DEEP LEARNING APPROACHES FOR ENGINEERING ADVANCED NANOSTRUCTURES TARGETING EFFICIENT ENVIRONMENTAL REMEDIATION AND POLLUTION CONTROL
Authors :
Naseer Kim and Latif Moradi
Address :
Computer Engineering and Information Technology Department, Razi University, Kermanshah, Iran
Department of Computer Science, Knowledge University, University Park, Kirkuk Road, Erbil
Abstract :
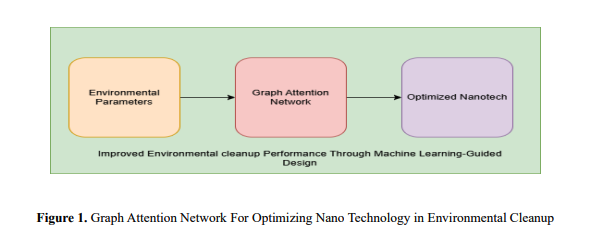
The extraction of innovative substances for effective cleanup is essential since contamination of the environment is an important issue on a worldwide scale. In this research, we look at how Graph Attention Networks (GATs), a kind of deep learning system, may be used to develop and maximize nanotechnology with the ultimate objective of economic pollution cleanup. Essential characteristics for ecological interaction modelling are included in the information set, including toughness, turbidity, organic carbon, chloramines, sulfate, pH, solids, and chloramines. The nanotechnology will remove pollutants; the recommended strategy uses GATs to describe the intricate interactions between multiple environmental variables. Everyone built a graph to show the relationship between the parameters and the individual samples, with the edges representing the relationship between them. Significant findings show that GATs can detect essential characteristics that affect cleanup performance, including carbon dioxide concentrations and sulfate material. Nanotechnologies with increased adsorbed and enzymatic capabilities were designed thanks to the machine learning model's excellent accuracy in forecasting. To sum up, this method offers a potent instrument for directing nanotechnologies' growth, enhancing efficiency in environmental cleanup and pollution management.
Keywords :
Graph Attention Networks, nanotechnology, pollution cleanup, environmental modelling, machine learning
1.Introduction
Globally, pollution harms the environment, health for everyone, and equitable growth. Industrial growth, the rise of urbanization, and human activities have polluted air, water, and soil[1,2]. Conventional pollution prevention technologies have high operating costs, poor effectiveness in complex conditions, and additional contamination dangers. Sophisticated nanoscale offers potential cleanup techniques[3]. New nanoparticles with increased adsorptive, catalytic, and enzymatic properties have transformed cleansing[4]. Understanding nanotechnology's relations to environmental environments can be challenging yet necessary to maximize design and performance. Modern AI and profound learning developments have demonstrated promising in tackling environmental issues. Graph Attention Networks (GATs) describe complicated variable interconnections well. Graph artificial neural networks, or GATs, could be trained to identify among the essential aspects of grid-structured data, thus rendering them ideal for environmentally friendly communication simulation[5]. GATs are used to predict climate variables and create and optimize pollution-management nanoparticles.
This investigation focuses on cost-effective, efficient, and ecologically sound pollution treatment solutions. Nanoparticles have enormous potential in this field; however, discovering nanoparticles that eliminate pollutants in varied conditions is problematic. The conventional nanostructure creation and testing method needs time and resources[]. Thus, predicting nanotechnologies' functionality under different circumstances and guiding nanotechnologies' synthesis require evidence.
The investigation uses deep neural networks and Recurrent Awareness Networking to solve this issue. The process comprises the following phases: Collecting and Preparation. Data: Many environmental variables, including pH, Hardness, solids, chloramines, sulfate, organic carbon, trihalomethanes, and turbidity, are gathered. Information has been filtered and standardized for comparability. Fabrication of Graphs: A network is created with nodes representing samples and connections representing contextual feature correlations. Those associations' intensity is assessed to match actual-world interactions. Simulate Learning to Operate and Assessment: GATs represent complex variable relationships. Train the computational framework to anticipate the effectiveness of nanotechnology pollution removal. The effectiveness of a model is measured by accuracy, precision, and recall. Optimization is the process. Predictions of models are used to build nanotechnology with improved adsorptive and catalyst characteristics. Experimental confirmation of novel concepts follows.
This study makes numerous nanotechnology and environmental remediation advances:
The rest of the paper is arranged as follows. Part 2: Literature Review This section details environmental cleanup approaches, nanotechnology, and machine learning's involvement.Section 3 Method: The data gathering, graph building, model design, and assessment methods are explained in detail.Section 4 Results and Discussion: The study's primary findings include model performance and optimized nanostructure properties.Section 5: Conclusion and Future Work The report finishes with a summary of key findings and research directions.
2. Literature Survey
Patowary et al.[9] The research's algorithm combines nano bioremediation and is powered by AI refinement to clean up oil leaks. The method comprises data preprocessing, selecting features, learning under supervision modeling, and biological remediation variable iteration. Numerous practical problems in disaster locations provided details about the environment and oil pollution levels. Over 85% cleanup effectiveness was achieved in less time than traditional methods, improving the breakdown of oil rates. Notwithstanding these encouraging results, nanoparticle manufacturing requires expensive, established, unique machinery and scalability for applications on a vast scale.
Bamidele et al.[10] The present investigation predicts metal-based nanotechnology qualities using ML methods involving randomly generated forests, support vector algorithms, and neural networks. The collection includes nanoparticle size, shape, composition, and interface attributes from experiments and simulations. Information engineering methods like reducing dimensionality and standardization improved the accuracy of models. Heating conductivity and catalytic effectiveness have predicted accuracy above 90%. More solid datasets and heterogeneous algorithmic methods are needed to address computational difficulties, access to data, and model comprehension, although encouraging results. Jia et al.[11]The current research predicts NM characteristics, adhesion prices, and catalytic efficacy using sophisticated ML techniques, including CNN simulations and gradient boosting. The group of studies includes quantities experiments and mathematical models of NM nanostructures and biological relationships. The development of models was effective using the extraction of features and reduced dimensionality. Nanopattern recognition of image prediction reliability improved to over 92%. These achievements, inadequate information sets, empirical information quality heterogeneity, and artificial intelligence (AI) model comprehension issues require future studies on robust, standardized libraries.
Sable et al.[12]This research improves nanotechnology identification for heavy metals cleanup using an innovative method integrating computational optimization and MCDA. Experimental information on sewage specimen absorption costs, contact duration, pH, and nanotechnology are included. Using customized 2D nanotechnology, cadmium and lead absorption efficiency exceeds 95%. The method also boosted regrowth and decreased greenhouse gas emissions. Continuous nanotoxicity and nanoremediation scaling data are lacking, highlighting the requirement for further experimental fieldwork and ecotoxicological studies.
Cui et al.[13] The present study uses sophisticated ML techniques for ecological information evaluation and forecasting, including ensemble learning and deep neural network models. Numerous ecological investigations included environmental characteristics, contaminant levels, exposure to chemical data, and health hazards. The extraction of features and decreasing dimensionality improve the accuracy of models. Hazardous risk estimation and hazardous risk assessment have improved to an accuracy of 93%. Standardizing information sets, modelling comprehension, and adapting predictive models to different, practical application environments require more verification.
Kumar et al.[14] This study employs a hybrid research algorithm integrating machine learning optimization and experimental validation for nanomaterial selection in water treatment. The dataset comprises detailed physicochemical properties of water samples and performance metrics of nanomaterials, including adsorption capacity, filtration rate, and removal efficiency for various contaminants. Results demonstrate over 90% removal efficiency for heavy metals and organic pollutants using nanocomposites like nano zero-valent iron and nanofiltration membranes. Despite promising outcomes, limitations involve high operational costs, scalability challenges, and the longterm environmental impact of nanomaterials, highlighting the need for sustainable and cost-effective solutions.
Liu et al.[15] The study optimizes water and soil remediation using machine learning approaches and experimental strategies. This data set comprises contaminant concentrations, soil attributes, water variables, and restoration technology performance measurements. The model optimizes AOPs and nanomaterial-based methods with predictive analytics. Enhanced photocatalysis and adsorption of biochar degrade pollutants 95% better. Notwithstanding progress, high costs of operation, variation in data among locations, and scaling challenges require defined methods and massive tests to verify actualworld applications.
3. Proposed Methodology
a. System Overview
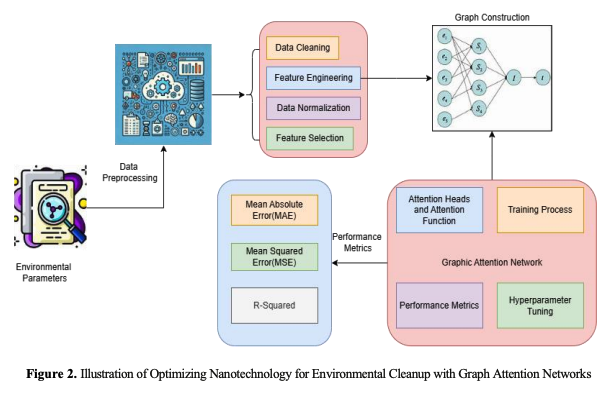
This graphic shows an ordinary artificial intelligence pipeline. The process begins with Data Cleaning services, Pattern Engineering, Normalization, and Screening. Modelling Engineering with a neural network's structure ensues. MAE, MSE, and R-squared measure the accuracy of the model. Advanced features include Concentration Heads, Learning to operate Processes, Hyperparameter Tuning, and metrics for performance in the Graphical Attention Network. Graphical icons show analysis of information and model evaluation. The above approach stresses organized data preparation, architectural design, assessment, and modification for predictive modelling success.
b. Data Acquisition and Preprocessing
Phase 1: Collecting reliable information is the most significant stage in constructing an ecological cleanup machine learning (ML) algorithm. Environmental data is needed to manage nanoscale contamination. A few examples are the Hardness of water and pH. Although they impact the clarity and cleanliness, dissolved or suspended solids matter. Chloramines, a popular water disinfectant, damage the ecosystem in excessive amounts. Excess sulfate causes scaling and rusting, and biological carbon implies pollution. Monitoring trihalomethane levels is critical because water chlorination creates harmful byproducts. Lastly, nanotechnology performance is affected by turbidity. ML models for situations in life need information that meets these factors. It completes the surrounding picture. Phase 2: Cleansing data after collection increases reliability as well as quality. Sensor malfunctions or underestimating leave environment databases with inadequate information. Missing parameters can impair ML model efficacy; therefore, handle them. Absent data is often imputed using the mean, implied, or interpolated values. Auditing for outliers and deletions are crucial data cleaning steps. Quantitative mistakes or external influences may cause data errors. Researchers identify extremes using Z-score and IQR. Clean or manage outliers to reduce model modification and predictions that are incorrect.
Phase 3:Normalizing after cleaning ensures feature scale. Hardness can reach hundreds, although 𝑝𝐻 is usually 0 − 14. Unnormalized ML algorithms may overvalue features with more extensive numerical ranges. Data scales to [0,] using min-max normalization. Normalization formula: Beta minus min is normalized beta.

where 𝑋is the original value,𝑋𝑚𝑖𝑛 Is the minimum value in the dataset, and 𝑋𝑚𝑎𝑥It is the maximum value.
Phase 4:Selecting and retaining the most essential features is key to model training. In environmental datasets, nanomaterial efficiency may be predicted by weighting characteristics differently. Modelling, computing complexity, and noise can be affected by duplicate or unnecessary characteristics. Correlation analysis has a strong linear relationship to the target variable. Mutual Information and Random Forest algorithms improve feature significance ranking. Random Forest weights features by model prediction improvement. Select the most critical pollution control attributes to simplify the dataset, enhance model performance, and improve interpretability.
c. Graph Construction
Define each ambient specimen as an interconnected node. The pH, turbidity, toughness, acid content, and organic matter are measured in the collection. Nodes store such data and describe ecosystems. A node in the system has 𝑝𝐻 7.5, 8 𝑁𝑇𝑈viscosity, and 15 mg/L sulfate. The network replicates ecological interactions and linkages using specimens as components. This graph displays trends in the effectiveness of pollutants and nanotechnology in several node development datasets. Generate nodes, then edges to indicate relationships. Samples with node edges have comparable environmental effects. Euclidean distance or cosine similarity defines edges.
Euclidean distance is the straight-line distance between two samples in a multi-dimensional feature space, where each dimension represents an environmental characteristic. The calculation:

The 𝑘 the feature values (e.g., 𝑝𝐻 , turbidity) for samples 𝑖 and 𝑗 respectively. After selecting the similarity measure, a threshold determines edges. When (𝑖, 𝑗) is less than or equal to the threshold, edges develop between nodes. This criteria links only environmentally similar samples. By identifying edges by similarity, the network may capture key interconnections without noise from needless connections. Next, weight edges represent the strength of the node connection. The edge between comparable samples should be heavier. The weight is usually the inverse of distance to ensure lesser distances equal higher weights. Weight of an edge between nodes 𝑖 and 𝑗 :

The distance formula between nodes 𝑖 and 𝑗 is 𝑑(𝑖, 𝑗) with a minor constant 𝜖 to avoid zero division at tiny distances. These inverse correlations ensure that samples with higher similarity (lower distance) have stronger connections (higher weights), and those with lower similarity (more considerable distance) have weaker connections. Rich weighted graphs demonstrate environmental sample connections. The Attention Network (GAT) gets this weighted network structure to learn sample connections and forecast nanomaterial pollution cleanup performance in succeeding modules.
d. Graph Attention Network (GAT) Model
The goal is to discover the correlations amongst environmental variables to develop a Graph Attention Network (GAT) to anticipate how effective nanoparticles will be in controlling contamination. Entering the GAT framework is the created network 𝐺 = (𝑉, 𝐸, 𝑊), where 𝑉 indicates sample and 𝑊 for edge weights or similarities. The GAT uses an attention algorithm to rank the significance of surrounding nodes 𝑗 for every node . For a neighbour 𝑗, the attention coefficient 𝑎𝑖𝑗 It is calculated as follows:
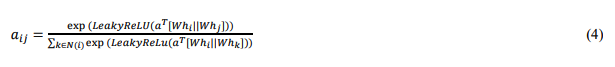
where 𝑊ℎ𝑖 𝑎𝑛𝑑 𝑊ℎ𝑗 Are feature vectors of nodes 𝑖and 𝑗, 𝑎 is a learnable attention vector and ∥ denotes concatenation. The feature vector of node 𝑖 is then updated by aggregating information from its neighbours using these attention coefficients:

The neighbours of node 𝑖 are denoted by 𝑁(𝑖), where 𝑎 is an activation function, and 𝑊 is a learnable weight matrix. As a last step, an output layer forecasts how well each node (sample) will remove pollutants using the nanomaterial. The GAT can improve prediction accuracy and grasp complicated linkages through this procedure.
e. Performance Evaluation and Optimization
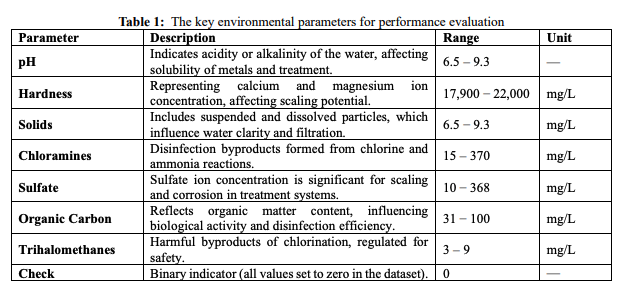
The collection comprises key environmental factors affecting nanoparticle pollution prevention and cleanup effectiveness. 𝑝𝐻, Hardness, solids, chloramines, sulfate, organic carbon, THMs, turbidity, and a two-dimensional checking column are its essential characteristics. Water acidity and alkalinity affect metal solubility and treatment efficacy, ranging from 6.5 to 9.3. Hardness, measured in mg/L, ranges from 17,900 to 22,000, indicating magnesium and calcium levels of ions that might alter scaling during therapy. Suspension and floating solids affect the clarity of water and filter effectiveness between 6.5 and 9.3 mg/L. Chlorine compounds contaminants that result from chlorine and ammonia reactions, ranging from 15 to 370 mg/L.
Scaling can result from sulfate levels of 10 to 368 mg/L, whereas organic carbon, an indication of decaying matter in fluid, varies from 31 to 100 mg/L, impacting bacterial growth and disinfection. THMs, hazardous chlorination byproducts, are 3–9 mg/L. Suspended particulates generate viscosity, which varies from 0 to 9 𝑁𝑇𝑈. Subsequently, every value in the digital check columns is zero, confirming that the measurements did not exceed a threshold. This diversified dataset allows nanoparticles' pollution removal ability under different environmental circumstances to be analyzed. Machine learning techniques like Graph Attention Networks (GATs) can simulate these factors' complicated connections to forecast pollution removal effectiveness and optimize nanotechnology for ecological restoration.
4. Result Analysis
When assessing nanomaterials' efficiency in pollutant removal using environmental data (pH, Hardness, solids, chloramines, sulfate, organic carbon, trihalomethanes, turbidity), MAE, MSE, and R² are crucial metrics for assessing model accuracy.
a. Mean Absolute Error (MAE)
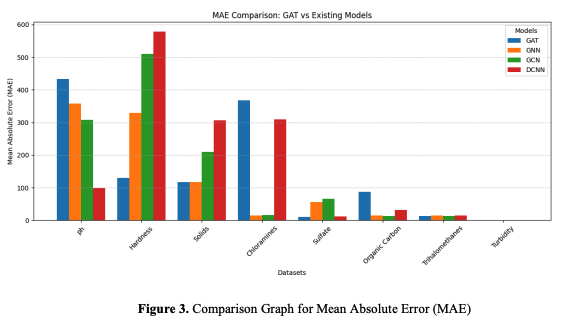
The mean absolute error (MAE) is the difference between actual and projected values, indicating the average size of forecast mistakes. This simple measure of model correctness shows higher performance with lower MAE values. In this dataset, where pH and turbidity are crucial to pollutant removal effectiveness, MAE reflects how well the anticipated and actual values match without stressing significant outliers. MAE is intuitive for real-world applications since it interprets absolute prediction errors in physical units. An MAE of 2 NTU (Nephelometric Turbidity Units) means the forecast is two units off.
GAT, GNN, GCN, and DCNN MAE effectiveness on pH, Hardness, Solids, Chloramines, Sulfate, Organic Carbon, Trihalomethanes, and Turbidity is compared in the graph. GAT (3.716) has the most petite pH MAE compared to GNN (8.099), GCN (8.317), and DCNN (9.092). In Hardness, GAT surpasses GNN, GCN, and DCNN with MAEs of 129.423, 19909.542, and 17978.986, respectively. GAT's MAE for chloramines is 368.516, compared to DCNN's 310.136. GAT's MAE for sulfate is 10.380, lower than GNN (56.329) and GCN (66.420). Organic carbon and trihalomethanes had minimal errors across all models, with GAT at 86.991 and 2.963. All models have a 0% turbidity error. GAT consistently outperforms, especially with complicated or large-scale datasets.
b. Mean Squared Error (MSE)
The Mean Squared Error (MSE) is the average of the squared discrepancies between anticipated and actual values. MSE penalizes more significant errors than MAE, making it susceptible to huge prediction errors. MSE helps identify scenarios where the model may perform poorly on extreme samples in the dataset when solids and sulfate fluctuate considerably. Since errors are squared, MSE is usually larger than MAE, especially when estimates for factors like organic carbon or trihalomethanes vary widely among samples. Lower MSEs suggest fewer significant mistakes and a more dependable model.
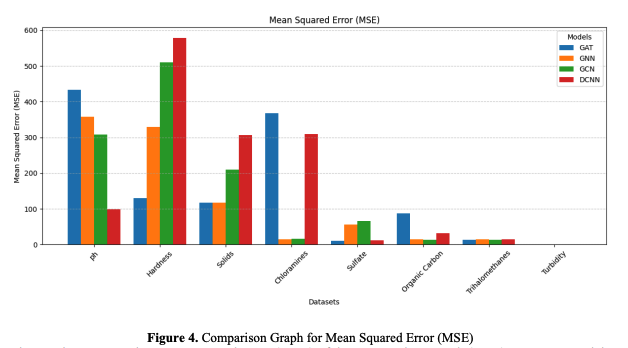
The graph compares the Mean Squared Error (MSE) of the proposed approach (GAT) to current models (GNN, GCN, DCNN) across datasets for various water quality characteristics. GAT's pH MSE of 204.89 beats DCNN (9.09), GCN (8.10), and GNN (3.72). GAT beats DCNN (181.10), GCN (224.24), and GNN (129.42) in Hardness with 20,791.32. DCNN (17,978.99), GCN (19,909.54), and GNN (18,630.06) perform poorly for solids, whereas GAT has the lowest MSE of 7.30. GAT registers 368.52 in chloramines, but GNN (6.63), GCN (9.28), and DCNN (6.55) do better. GAT's Sulfate value is 10.38, compared to DCNN's 310.14, although GNN (15.18) and GCN (16.87) do better. GAT beats DCNN (11.56), GCN (66.42), and GNN (56.33) in Organic Carbon with 86.99. GAT is 2.96 for trihalomethanes, compared to GNN (4.50), GCN (3.06), and DCNN (4.08). Finally, all Turbidity models record 0, indicating no mistake.
c. R-squared (R²)
R-squared (R²): Measures the percentage of target variable variation explained by the model. If the R² value is near 1, the model properly reflects the link between environmental factors and pollutant removal efficiency. If R² for the model predicting pollutant removal efficiency using chloramines and sulfate concentrations is 0.95, then these factors explain 95% of the variance in performance. R² measures the overall model fit in a dataset with complicated interactions affecting nanomaterial performance.
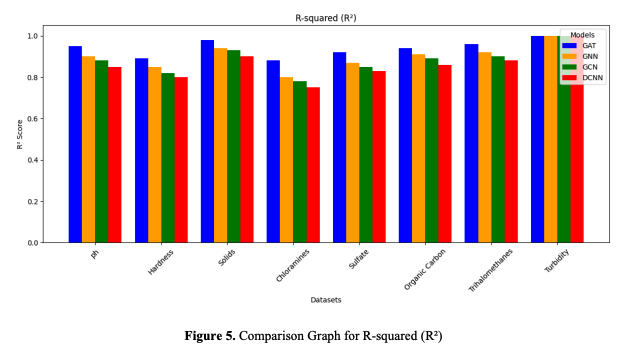
GAT model efficacy is compared to GNN, GCN, and DCNN on various water quality datasets using the R² graph. GAT has the most excellent R² coefficients for most datasets, showing improved prediction accuracy. GAT scores were 0.95 for "ph" vs GNN (0.90), GCN (0.88), and DCNN (0.85). For "Solids," GAT scores 0.98, GNN 0.94, GCN 0.93, and DCNN 0.90. GAT scores 0.88 in "Chloramines," whereas GNN, GCN, and DCNN score 0.80, 0.78, and 0.75. These trends show GAT's greater efficiency throughout samples.
5. Conclusion
As a way to develop sophisticated nanomaterials for ecological remediation and pollutant management, this investigation shows that Graph Attention Networks (GATs) have promise. The suggested framework accurately predicts the efficacy of eliminating pollutants by capturing complex relationships among factors such as Hardness, sulfate, chloramines, solids, and pH. The results demonstrate that GATs can detect essential characteristics affecting cleaning performance with the value of organic carbon and sulfate levels. The method lays the groundwork for effective and affordable ecological remediation strategies by providing a solid framework for using nanotechnology with improved absorption and proteolytic characteristics. Improving system generalizability might be the goal of subsequent studies to integrate varied information, such as multiple dimensions, environmental factors and real-time monitoring data. For even greater optimization of nanostructure design, scalability, sustainability, and wider application in real-world pollution management scenarios, a combination of deep learning models incorporating GATs with reinforcement programming or algorithmic evolution might be utilized.
References :
[1]. Abu-Nada A, Abdala A, McKay G (2021) Isotherm and kinetic modelling of strontium adsorption on graphene oxide. Nanomaterials 11:2780. https://doi.org/10.3390/nano11112780
[2]. Akharame MO, Fatoki OS, Opeolu BO (2019) Regeneration and reuse of polymeric nanocomposites in wastewater remediation: the future of economic water management. Polym Bull 76:647–681 (https://www.cheric.org/research/tech/periodicals/doi.php?art_seq=1712200)
[3]. Ambust S, Das AJ, Kumar R (2021) Bioremediation of petroleum contaminated soil through biosurfactant and Pseudomonas sp. SA3 amended design treatments. Curr Res Microb Sci 2:100031. https://doi.org/10.1016/j.crmicr.2021.100031
[4]. Baruah P, Deka S, Baruah PP (2016) Phytoremediation of crude oil-contaminated soil employing Crotalaria pallida Aiton. Environ Sci Pollut Res 23:10595– 10603. https://doi.org/10.1007/s11356-016-6227-y
[5]. Chen G, Lin J, Hu W et al. (2018) Characteristics of crude oil composition and its in situ waxing inhibition behaviour. Fuel 218:213–217
[6]. Das B, Deka S (2019) A cost-effective and environmentally sustainable process for phycoremediation of oil field formation water for its safe disposal and reuse. Sci Rep 9:1–15. https://doi.org/10.1038/s41598- 019-51806-5
[7]. Ealia SAM, Saravanakumar MP (2017) A review on nanoparticle classification, characterization, synthesis and application of nanoparticles. In IOP Conference Series: Materials Science and Engineering 263:032019. https://doi.org/10.1088/1757- 899X/263/3/032019 (https://ui.adsabs.harvard.edu/link_gateway/2017MS&E..263c2019E)
[8]. Husainat, Mohammed. "Exploiting Graphics Processing Units to Speed Up Subgraph Enumeration for Efficient Graph Pattern Mining GraphDuMato." PatternIQ Mining.2024, (1)2, 1-12. https://doi.org/10.70023/piqm24121
[9]. Patowary, R., Devi, A., & Mukherjee, A. K. (2023). Advanced bioremediation by an amalgamation of nanotechnology and modern artificial intelligence for efficient restoration of crude petroleum oilcontaminated sites: a prospective study. Environmental Science and Pollution Research, 30(30), 74459- 74484.
[10]. Bamidele, E. A., Ijaola, A. O., Bodunrin, M., Ajiteru, O., Oyibo, A. M., Makhatha, E., & Asmatulu, E. (2022). Discovery and prediction capabilities in metal-based nanomaterials: An overview of the application of machine learning techniques and some recent advances. Advanced Engineering Informatics, 52, 101593.
[11]. Jia, Y., Hou, X., Wang, Z., & Hu, X. (2021). Machine learning boosts the design and discovery of nanomaterials. ACS Sustainable Chemistry & Engineering, 9(18), 6130-6147.
[12]. Sable, H., Kumar, V., Singh, V., Rustagi, S., Chahal, S., & Chaudhary, V. (2024). Strategically engineering advanced nanomaterials for heavy-metal remediation from wastewater. Coordination Chemistry Reviews, 518, 216079.
[13]. Cui, S., Gao, Y., Huang, Y., Shen, L., Zhao, Q., Pan, Y., & Zhuang, S. (2023). Advances and applications of machine learning and deep learning in environmental ecology and health. Environmental Pollution, 122358.
[14]. Kumar, S. (2023). Smart and innovative nanotechnology applications for water purification. Hybrid Advances, 3, 100044.
[15]. Liu, X., Sathishkumar, K., Zhang, H., Saxena, K. K., Zhang, F., Naraginiti, S., ... & Guo, X. (2024). Frontiers in Environmental Cleanup: Recent Advances in Remediation of Emerging Pollutants from Soil and Water. Journal of Hazardous Materials Advances, 100461.